We used 7,921 kWh and generated 8,143 kWh for a net of 223 kWh for the year.
This is part of our quarterly home performance reporting. All data is posted at netplusdesign.com
Note: I’m 11 months behind in finishing this update. Back dating the post to January 4 when I started it.
It was very close. After 2 years of missing our target by roughly 100 kWh, it feels good to be back
in positive territory.
This was the first year of Covid so I was interested to see if there were any pattern shifts. You could say I’ve been exercising a hybrid work style ever since we moved out of the city. Some years I worked in the office more, others less. Jill continued to work at an office till a few years ago.
So were there any noticeable changes? Maybe a slight uptick in stove/oven usage. I do recall Jill doing a bit more baking as did the nation which is how we had a flour shortage. And the refrigerator usage was up a bit. But otherwise, no big changes.
2020 was our 3rd highest energy usage year and our 6th highest solar generation year.
2020 summary: 11% warmer, 2% less usage and 2% more sun
Here’s our progress for the first 9 years in the house. Yes, 9 years. You know what that means? I’m planning a 10 year house anniversary edition blog post for next year. Hopefully it won’t be 11 months late like this edition.
This will be a short edition as there were no big surprises that needed analysis.
If you’re not a technical person, you can safely ignore this post. The only thing that you will notice is that when you go to uphillhouse.com, you are now directed to uphillhouse.netplusdesign.com. And the site looks a bit different, but otherwise no big changes.
Year summary: We used 8,062 kWh and generated 7,945 kWh for a net of -117 kWh for the year.
This is part of our quarterly home performance reporting. All data is posted at netplusdesign.com
Note: I’m 6 months behind in finishing this update. Back dating the post to January 4 when I statrted it.
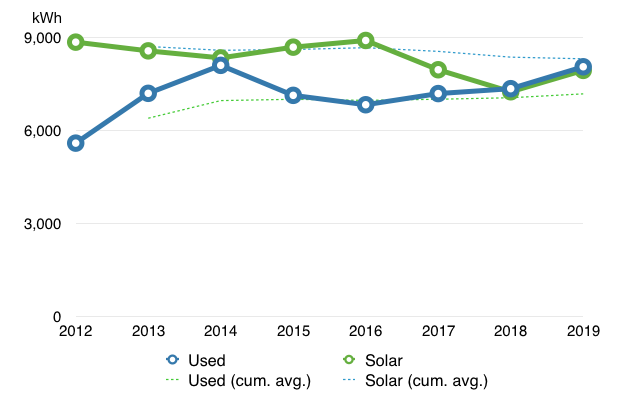
Last year we had relatively normal usage and rather low solar production. This year we have slightly less than normal solar, but higher usage. The end result is our second net overage in the lifetime of the house.
Chart showing solar and usage values for last 8 years
We produced 5% less solar than average, and used 14% more than average. That tipped the scales once again, just enough to push us into the negative zone. On the long view however, we’ve still generated a surplus of 9,040 kWh over the last 8 years since the house was built.
We were performing fairly normally until September. Let’s break down the numbers.
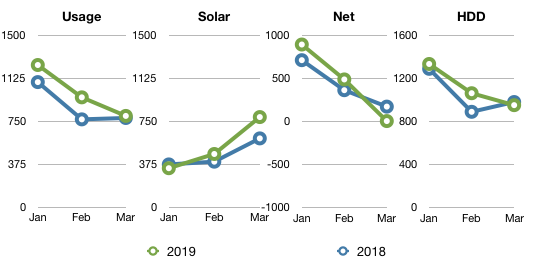
Q1 2019 summary: 6% colder, 14% more usage and 16% more sun as compared to Q1 2018.
This is part of our quarterly home performance reporting. All data is posted at netplusdesign.com
We recorded a low of -11.8 on January 22, far from our lowest recorded temperature of -17.3°F on February 14, 2016. Our high was 69.5, lower than the 77.6°F last year. In 2012 we recorded a high of 82.4°F in the same period.
Overall, here’s how this quarter compared to 2018.
Year summary: We used 7,356 kWh and generated 7,256 kWh for a net of -100 kWh for the year.
This is part of our quarterly home performance reporting. All data is posted at netplusdesign.com
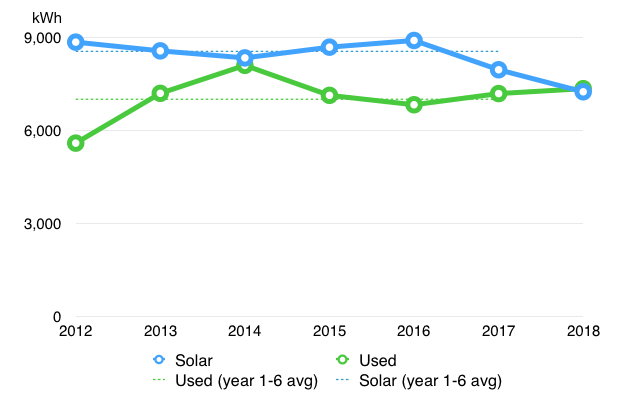
2018 is the first year we have not generated a solar surplus. In short, we produced 15% less solar than average, and used 5% more than average. That tipped the scales just enough to break our 6 year net zero running streak. On the long view however, we’ve generated a surplus of 9,157 kWh over the last 7 years since the house was built.
Chart showing solar and usage values for last 7 years
We were performing fairly normally until Q4. Let’s break down the numbers.
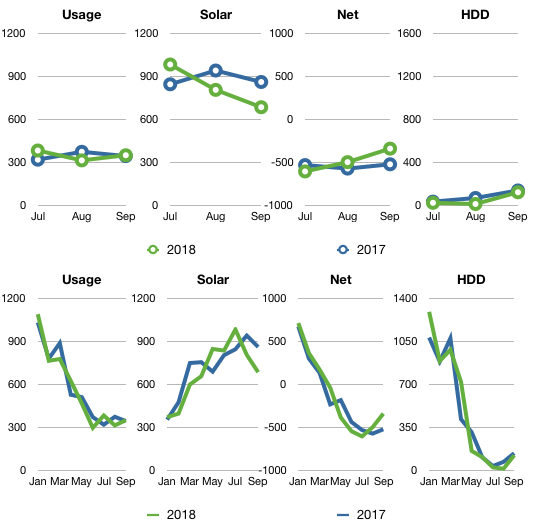
Q3 2018 summary: 33% warmer, 1% more usage and 7% less sun as compared to Q3 2017.
This is part of our quarterly home performance reporting. All data is posted at netplusdesign.com
Nothing exciting to report, which is normal for 3rd quarters.
At 7am on July 15th we became net positive for the year. As of the end of September, we have a surplus of 1,115 kWh heading into the final months of 2018. That’s about 211 less kWhs than last year at this time. Overall for the year, our solar production is down about 7%.
Overall, here’s how this quarter compared to 2017.
Chart showing usage, solar, net and hddRead more...


![Hourly temperatures [2012-2018] visualization](/assets/img/2019/01/circle_02.2019120132036small.png)
![Hourly temperatures [2012-2018] visualization](/assets/img/2019/01/circle_03.2019120132036medium.jpeg)